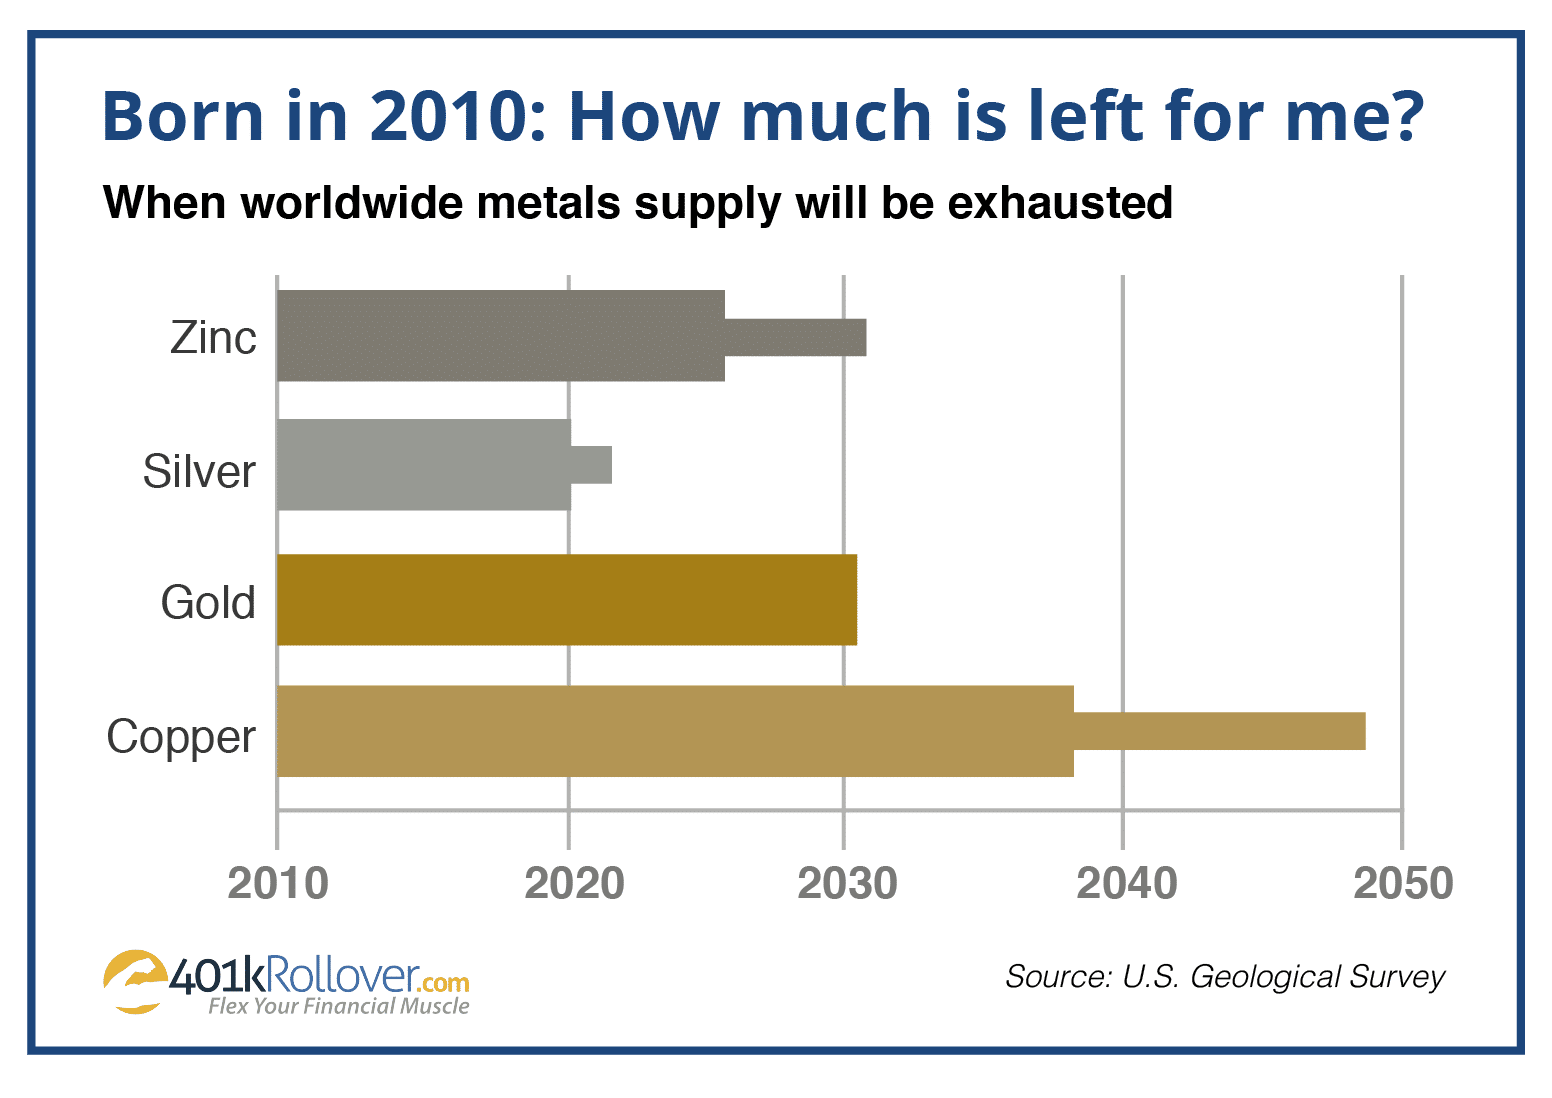
The US Geological Survey (USGS) has publicly stated that the world’s silver supply will be depleted by 2025. This will make silver the first widely used industrial commodity to have its in-ground supply exhausted.
The world’s top metals research team reports annual shortfall for silver
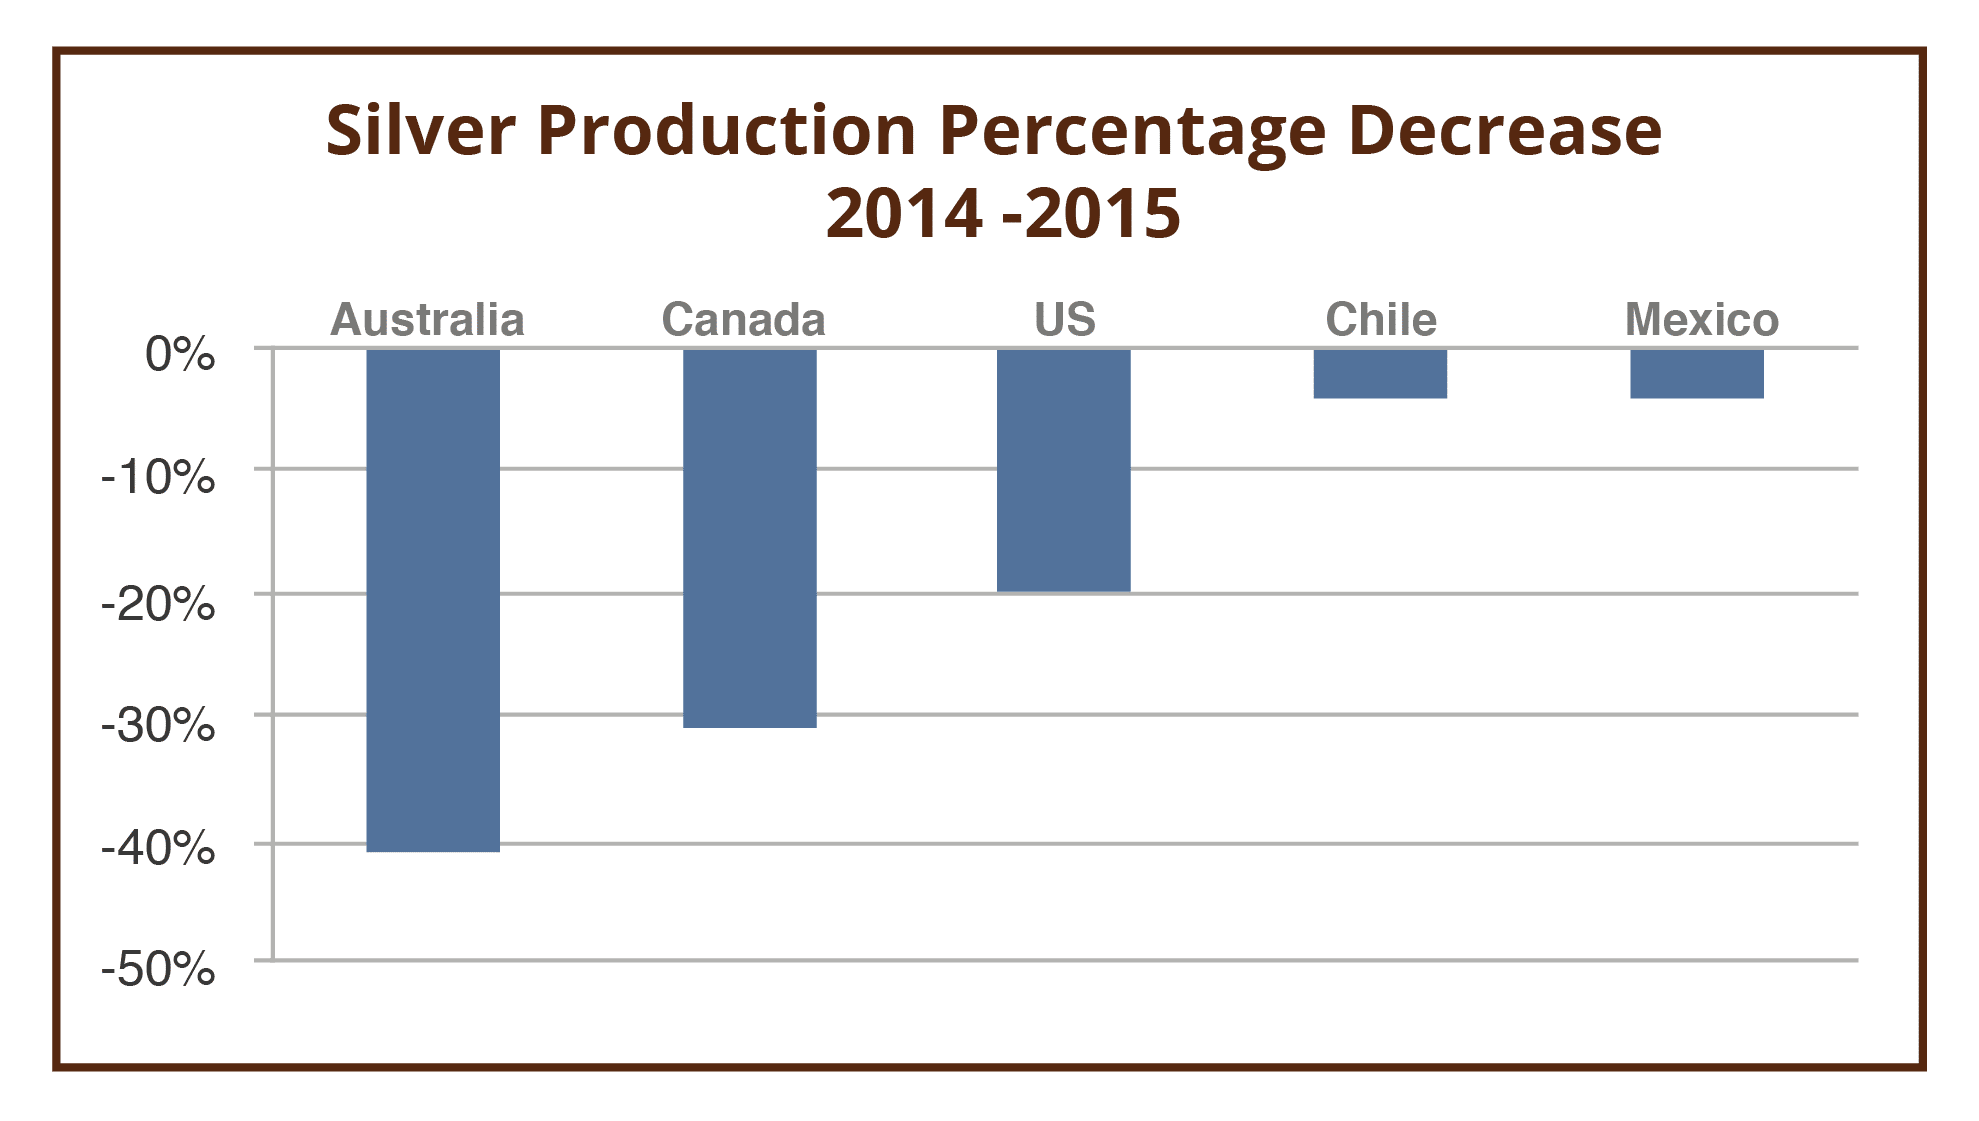
Thomas Reuters GFMS has reported a shortfall in global silver production for the third year in a row. For 2015 the shortfall was 42.7 million ounces. Several annual shortfalls could mean pressure on price increases for silver.
What is causing the shortfall of silver and why is the problem expected to grow?
Silver is the most effective conductor of electricity and it is used in most modern day electronics. The solar panel & smartphone markets will continue to be driving forces behind the enormous upside potential in silver through 2024.
According to a 2014 Erickson Mobility Report, 140 million phones and tablets ended up in US landfills as users upgraded. Less than 11 million or fewer than 9% of these devices were recycled.
Chinese & Indian Smartphone and Tablet markets guarantee further Silver shortfalls

By 2018 more people will have smartphones than have electricity worldwide. Currently 48% of the Chinese population have smartphones and in India it’s only 20%. These two countries are expected to add another 1.2 billion new smartphone users within 2 years.
Gold Vs Silver – Silver has 10 times more potential than gold
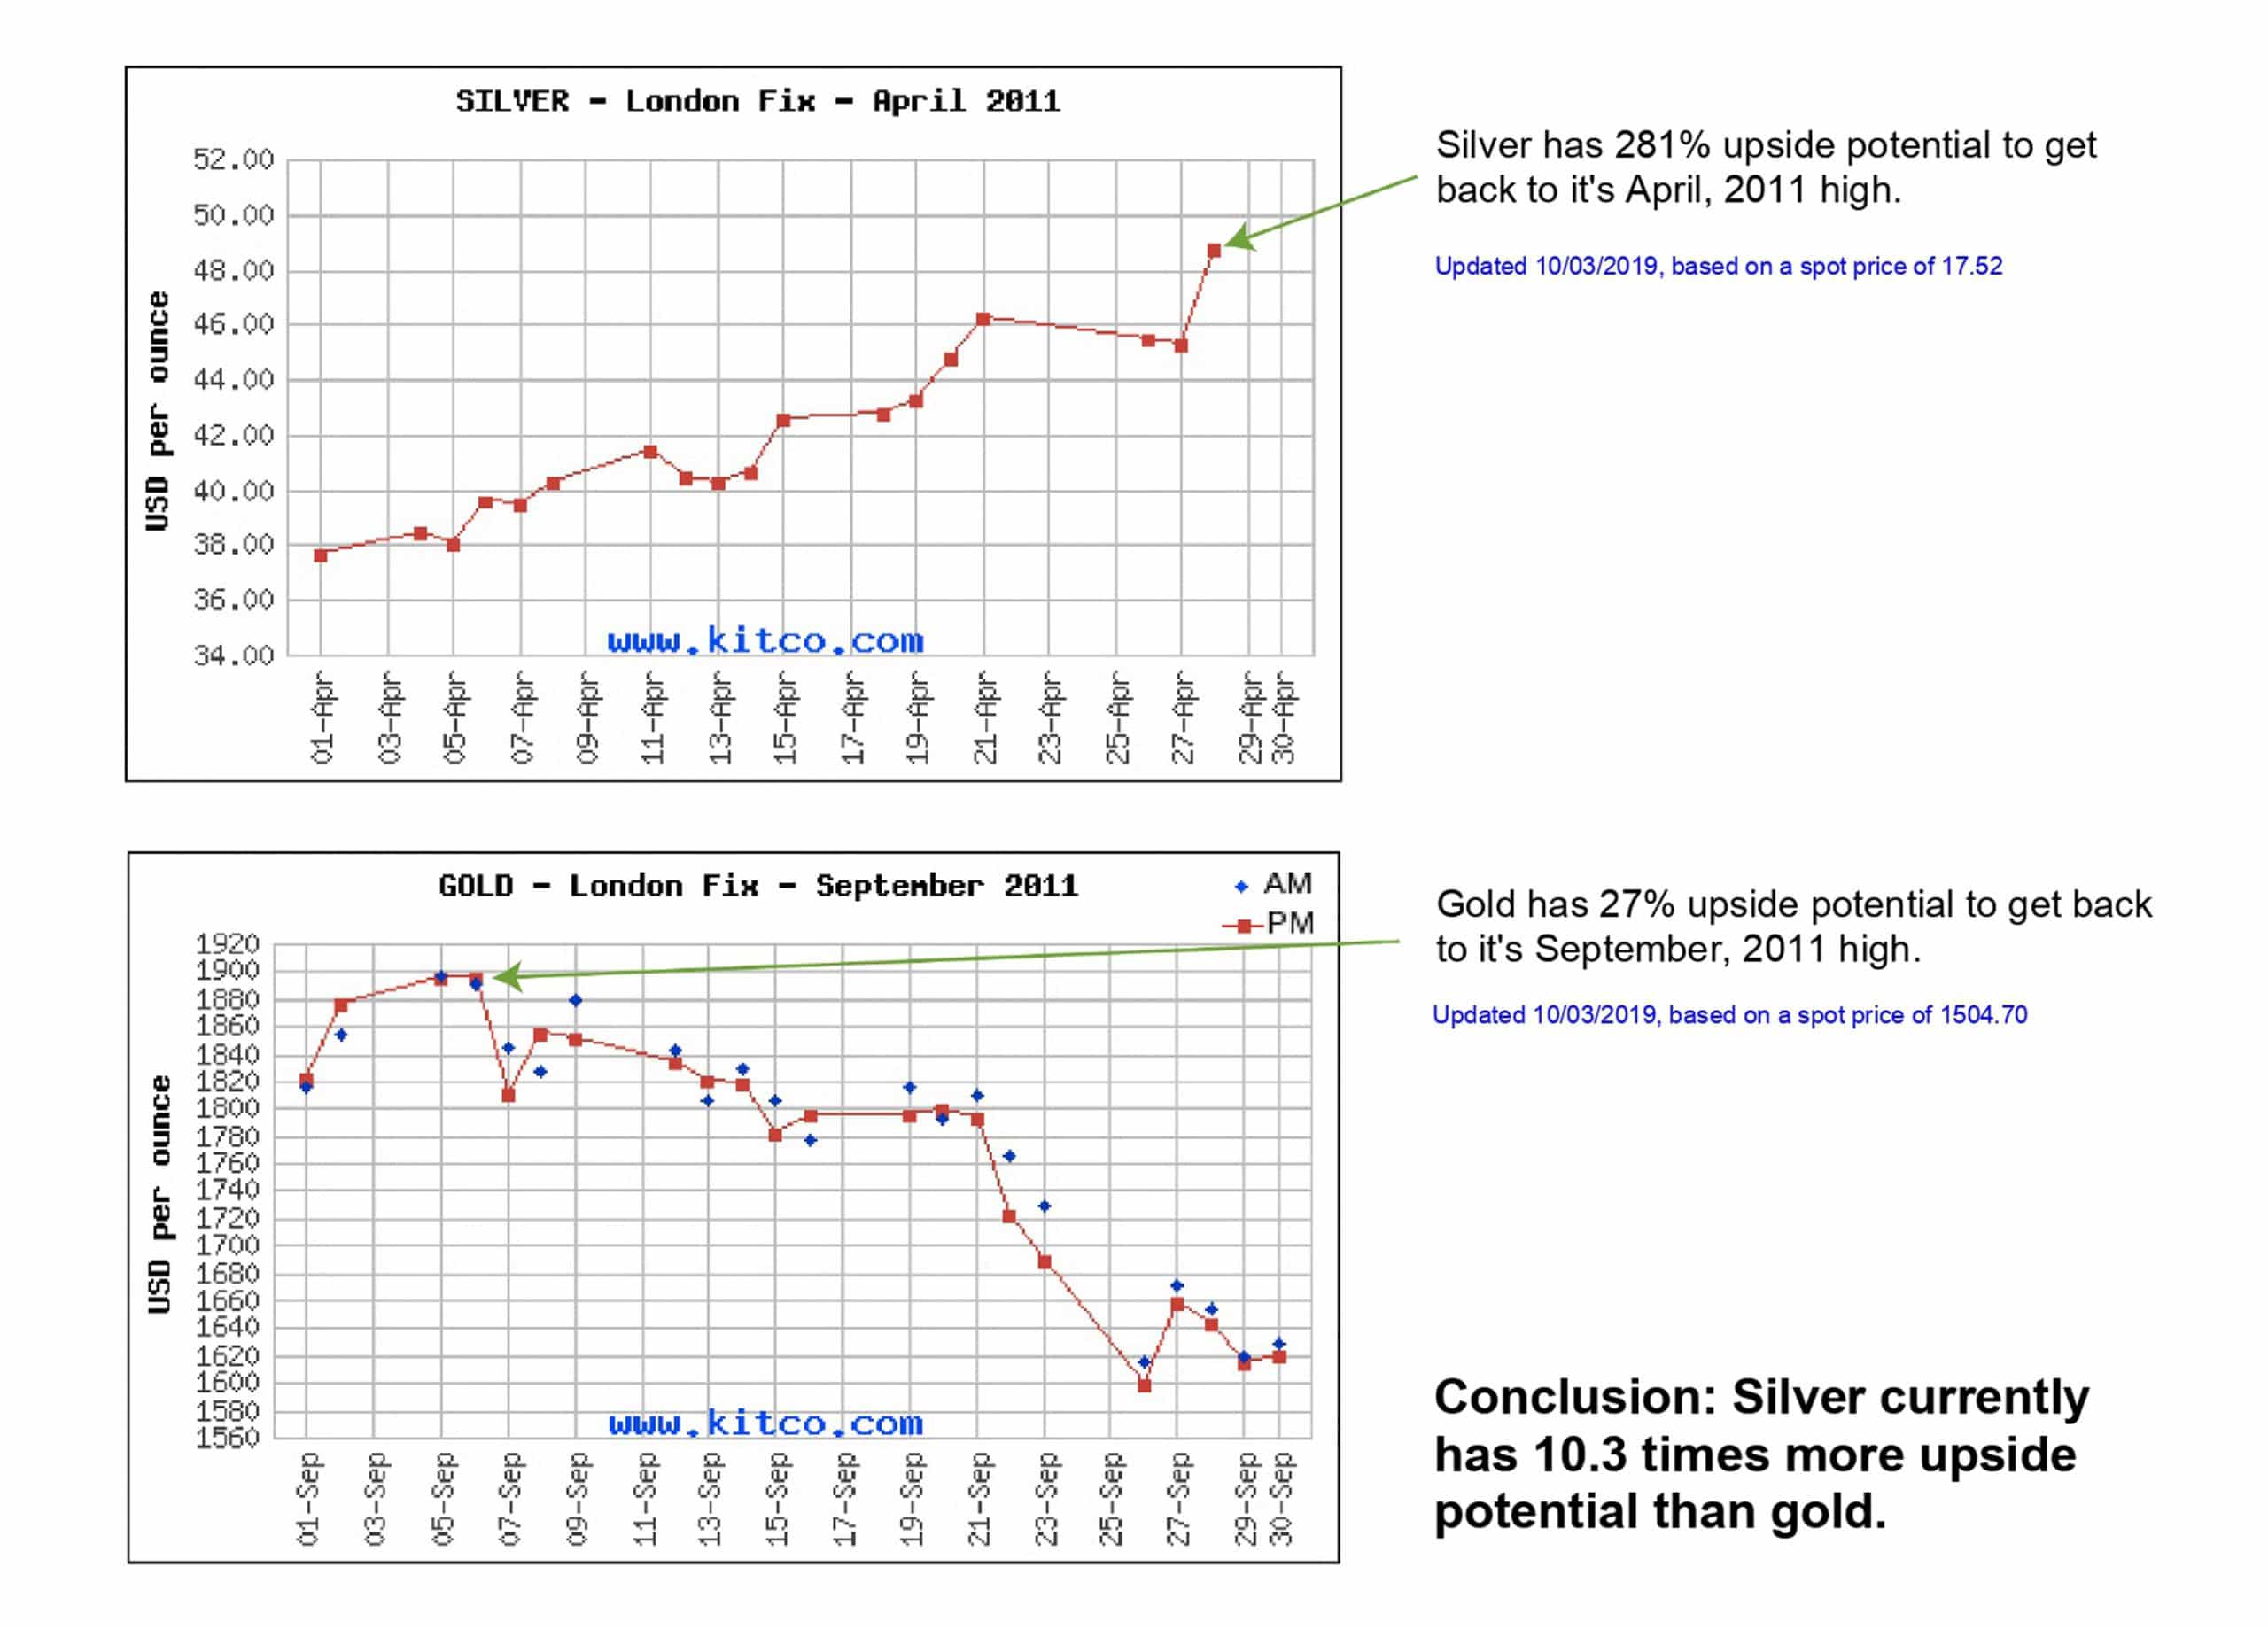
Gold and silver reached their recent historical highs in 2011. At that time gold reached, $1896.5 and silver peaked at $48.70. From their current levels to those 2011 levels is a 281% gain for silver and a 27% gain for gold, giving silver 10.3 times more upside potential.
Gold to Silver Ratio: The Key to Higher Profits
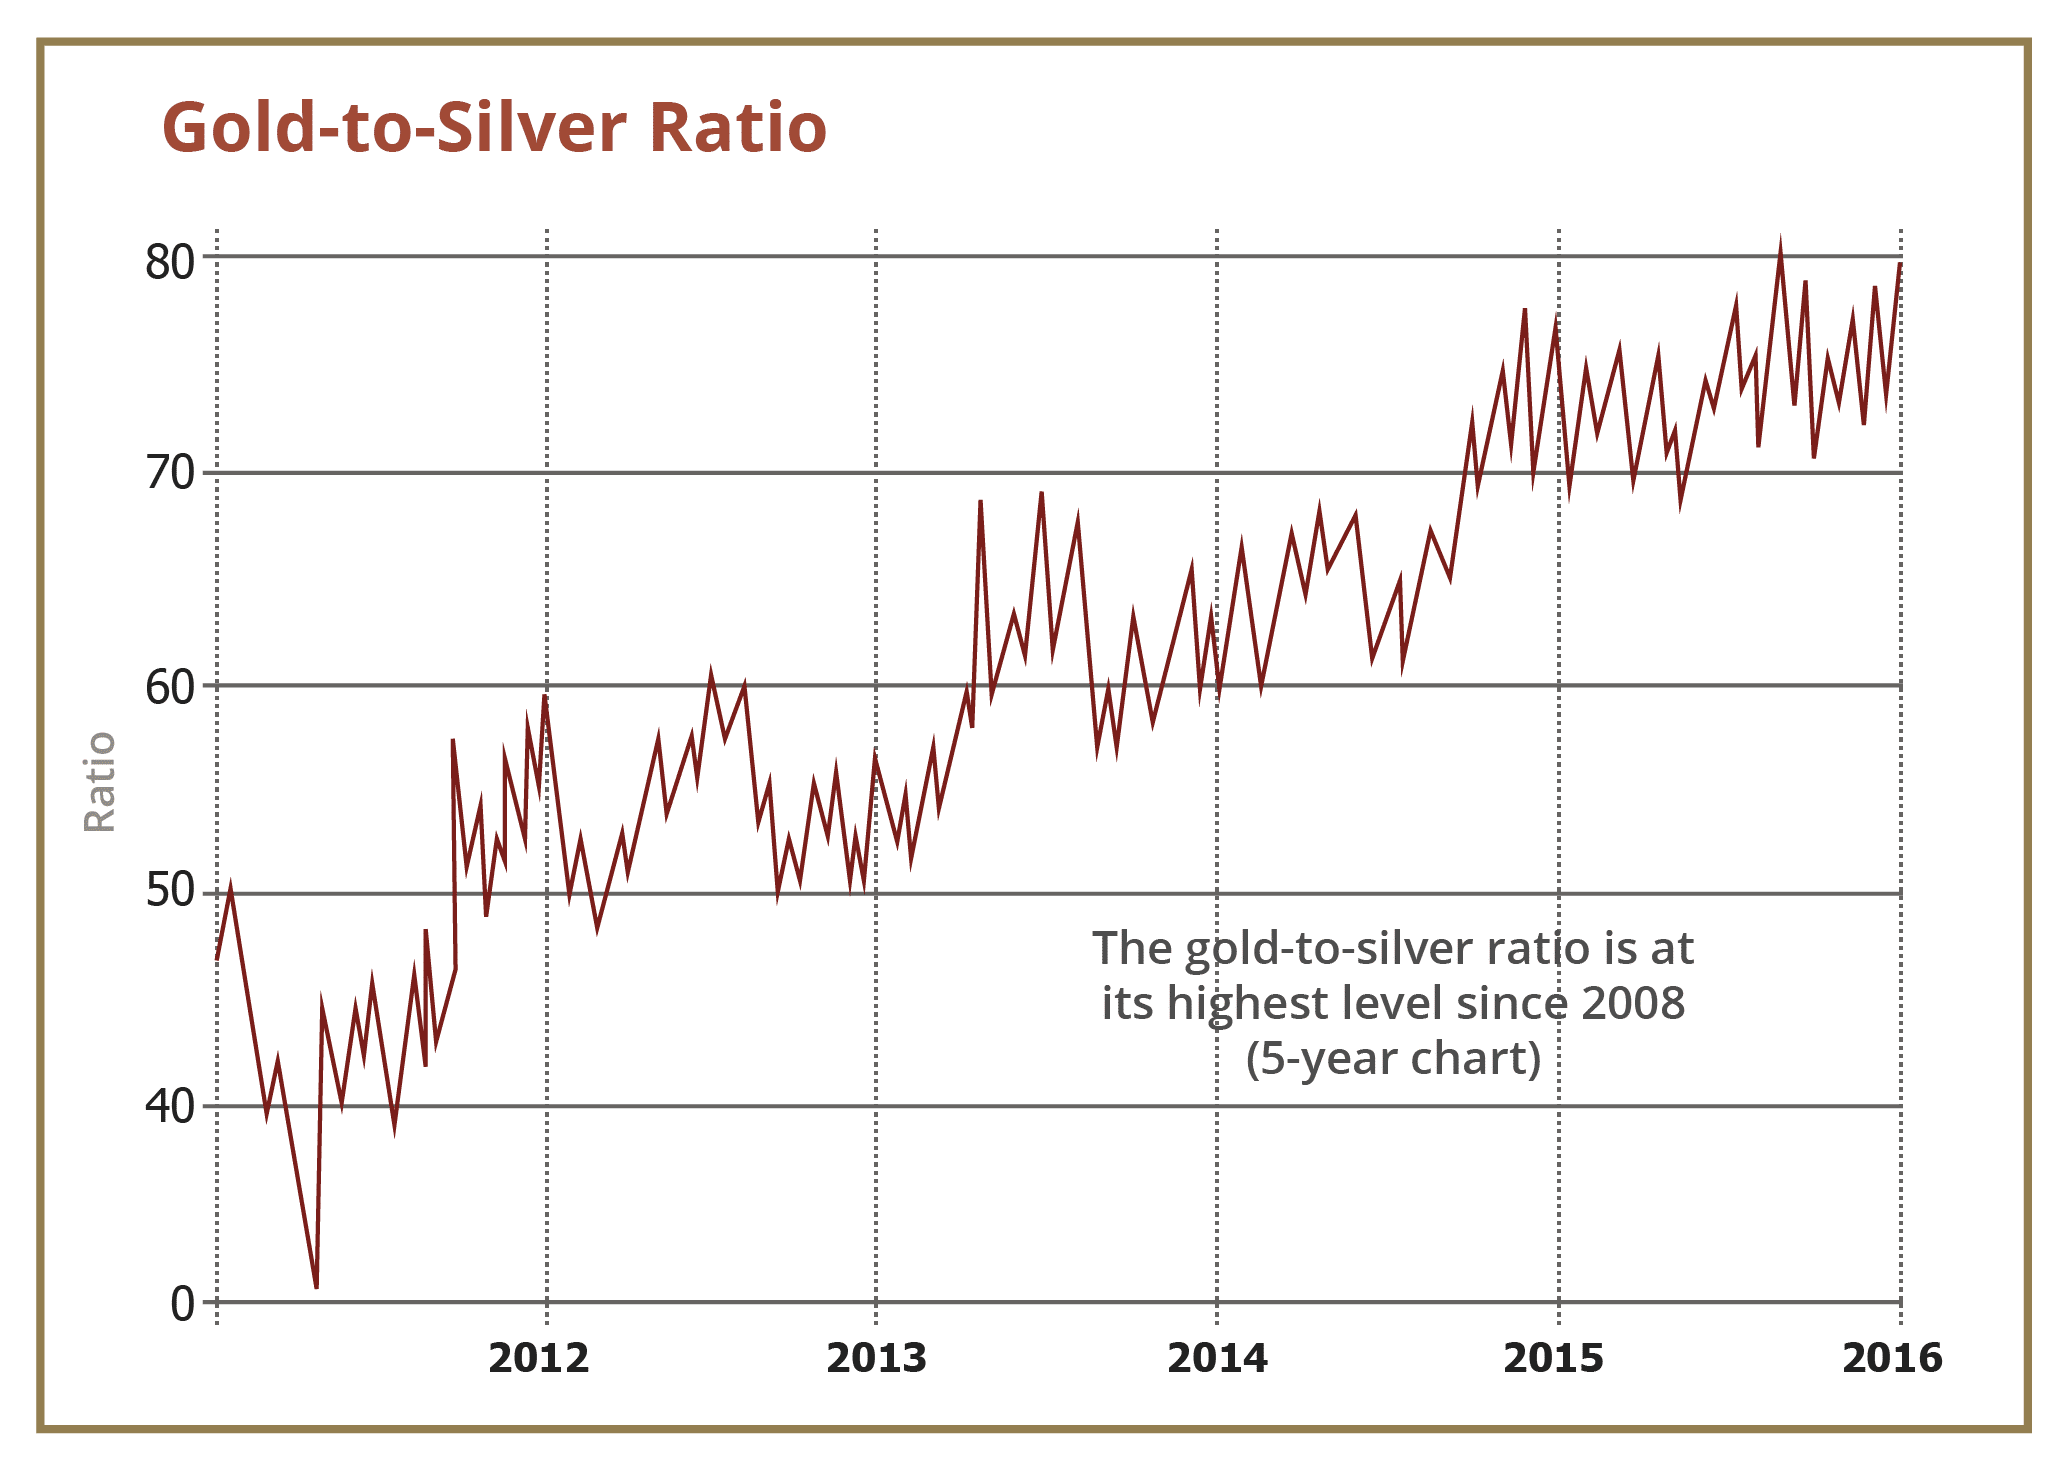
For 2,000 years the gold to silver ratio was around 12 to 1. In other words, you could trade 12 ounces of silver for one ounce of gold. That’s certainly not the case today because the gold to silver ratio is 85 to 1.
This is a very rare occurrence. In fact, it’s the first time it hit this level since October, 2008. And last time this ratio was over 80 to 1, the price of silver vastly outperformed gold.
The tables below show the last two times the gold to silver ratios reached these levels, and how silver outperformed gold for the following three years.
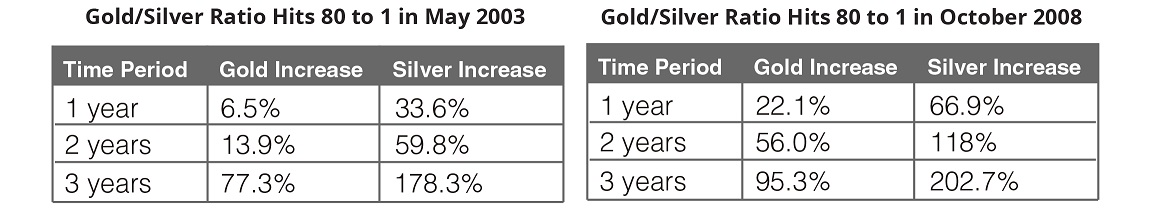
On October 3rd, 2019 the gold and silver ratio hit 85 to 1 causing the start of the next three year cycle.
History proves that silver is hands down a better investment than gold when the ratio is above 60 to 1 and that gold would be a better investment with levels below 30 to 1.
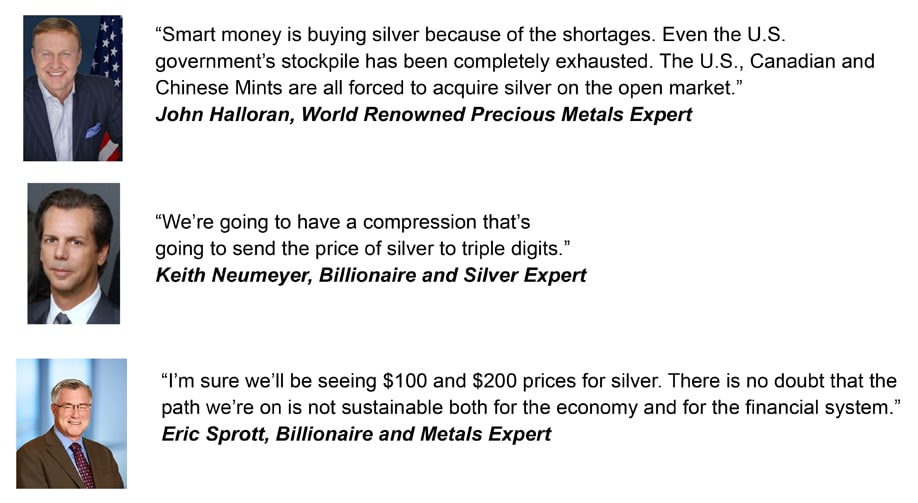
Here’s what experts are saying about silver:
Turning a buck into two or three
To conservatively turn one buck into two or three is a real possibility in the physical silver market by 2025. Low supply and high demand currently position silver for big gains and I admit, in the current investment environment, I would be happy to turn a buck into two or three over the next few years.


