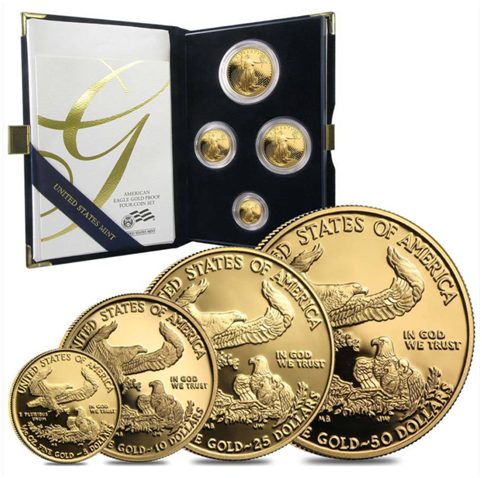
The American Eagle coin is the most popular coin in the world. The proof version of this coin is also an extremely popular collector version that is prized by savvy IRA and 401k investors. The reason this coinage is so popular is because it is sold directly by the US mint. Collectors coins are believed to be non-confiscatable because of legal precedence.
In the 1933 executive order confiscating gold bullion, Franklin Delano Roosevelt exempted collector coins of rare and unusual beauty. Because the United States works on legal precedence most investors that expect another financial depression prefer the Proof Eagle over the cheaper bullion version.
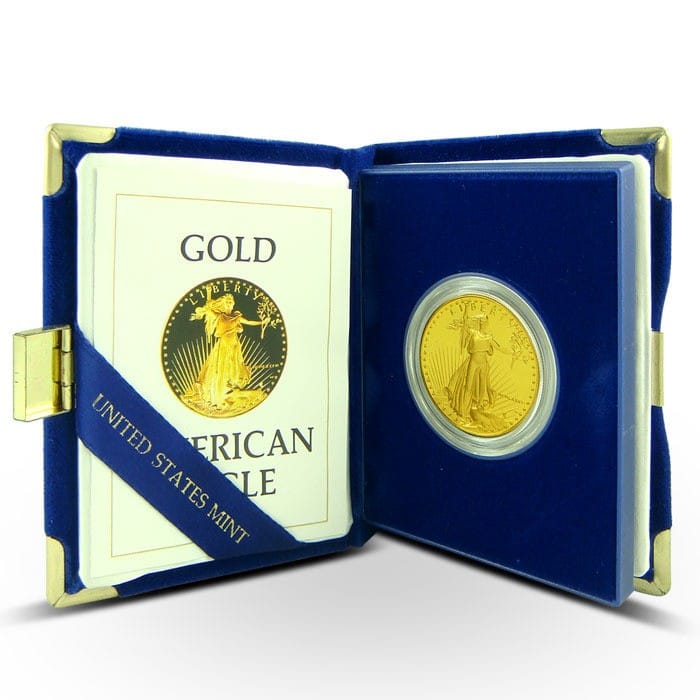
The Proof coin is exceptionally beautiful because it is struck twice unlike the bullion Eagle that is single strike coinage. This double strikage makes for a much more beautiful coin. Each coin comes in a velvet box with an accompanying certification of authenticity from the US Mint. The US Mint offers a one ounce, half ounce, quarter ounce and tenth ounce coins. Four coin sets are also available and total 1.85 ounces of gold consisting of a one ounce, half ounce, quarter ounce and tenth ounce coin.
Retail dealers typically sell the four coin sets at a premium above the total weight however wholesalers will generally sell the weightage at the same price as the one ounce coin but multiplied times 1.85.

The performance of the Proof American Eagle gold coins at times outperforms the bullion version. In fact, when gold reached its 2011 historic high of $1900, the proofs were selling at $3200. Many metals experts believe that if the generic bullion spot price indicator hits $3,000 as expected then the Proof American Eagle coins will be selling for between $4,600 and $5,200 per ounce.
What Is the Fair Market Value in 2020 for the American Eagle Proof Coins?
Gold spot is up over 20 percent in 2020 and the Proof is doing better than the generic bullion with returns of more than 30 percent this year. Many feel this rally is just getting started because demand for metals has skyrocketed this year due to the Covid 19 pandemic. This market is also expected to continue to grow steadily over the next 4 years because excessive government bailout money is weakening the US dollar.
In fact, very few dealers have any quantity of the American Eagle Proof coins. This low supply and high demand is expected to increase as we move into the second half of the year. Only the largest US dealers have adequate quantities. As of late only the US mint and one or two other dealers are able to fulfill IRA accounts. Expect to pay at or very near US Mint prices. If they are below that by more than 30 dollars you may be dealing with a less than reputable dealer and purchasing spotty inventories that could possibly be rejected by the IRA depository.
The American Eagle Proof Coin is 10.7 Times More Rare Than the Bullion Gold Eagles.
Investors that understand the law of supply and demand understand that scarcity always commands a premium. Please note that the US Mint has not released the mintage for the last several years but the proofs have likely become even more rare since the 2016 mintage.
Date Gold Eagle Bullion Vintage Proof Mintage
1986 1,362,650 446,290
1987 1,045,500 147,498
1988 465,600 87,133
1989 415,790 54,570
1990 373,210 62,401
1991 243,100 50,411
1992 275,000 44,826
1993 480,192 34,369
1994 221,663 46,674
1995 200,636 46,368
1996 189,148 36,153
1997 664,502 32,999
1998 1,468,530 25,886
1999 1,505,026 31,247
2000 433,319 33,007
2001 143,615 24,555
2002 222,029 27,499
2003 416,032 28,344
2004 417,019 28,215
2005 356,555 35,236
2006 237,510 47,092
2007 140,016 51,810
2008 710,000 30,237
2009 1,493,000 0
2010 1,125,000 59,480
2011 857,000 48,306
2012 675,000 23,630
2013 758,500 24,710
2014 425,000 28,707
2015 626,500 32,652
Data Provided by the US Mint


